
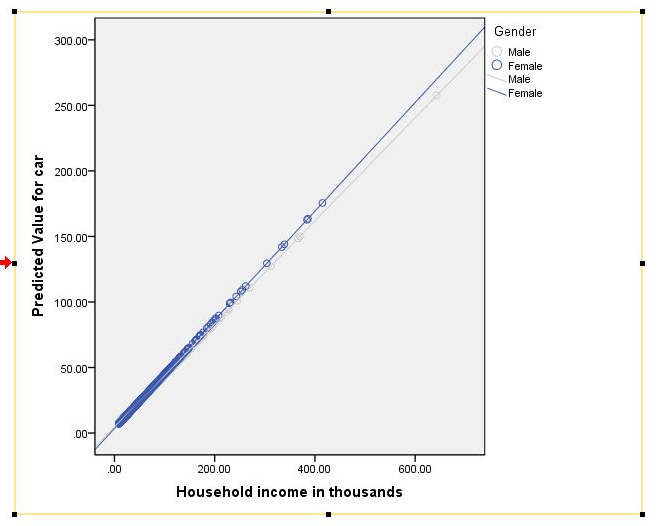
So you've run your general linear model (GLM) or regression and you've discovered that you have interaction effects. Now what? Next, you might want to plot them to explore the nature of the effects and to prepare them for presentation or publication! The following is a tutorial for who to accomplish this task in SPSS. A follow-up tutorial for how to do this in R is forth coming.
Read More