Help me decide what to blog about. What topics do you want to hear about?
Read MoreHelp me decide what to blog about. What topics do you want to hear about?
Read MoreThe distinctions between ANOVA, ANCOVA, MANOVA, and MANCOVA can be difficult to keep straight. Before one can appreciate the differences, it is helpful to review the similarities among them. The core component of all four of these analyses (ANOVA, ANCOVA, MANOVA, AND MANCOVA) is the first in the list, the ANOVA.
Read MoreWithin-person (or within-subject) effects represent the variability of a particular value for individuals in a sample. You see this commonly examined in repeated measures analysis (such as repeated measures ANOVA, repeated measures ANCOVA, repeated measures MANOVA or MANCOVA…etc). In these instances, a within person effect is a measure of how much an individual in your sample tends to change (or vary) over time. In other words, it is the mean of the change for the average individual case in your sample.
Read MoreFormatting a graph that was exported from SPSS to Microsoft Word can be an absolute pain. Since neither program is known for it's simplicity or "user-friendliness", the interaction between the two can be predictably tedious and frustrating. The process of converting a standard SPSS table to APA format might be bearable, when you are talking about a single table, but can become overwhelming when you have an entire manuscript worth of tables. Fortunately, a few minor alterations to your SPSS settings can make SPSS do most of the heavily lifting for you, making SPSS automatically produce tables that closely resemble APA format and cutting down your formatting time by as much as 90%!
Read MoreThe following is one of the best introductions to R programming that I've found online. It is part of a larger series of tutorials created by Jared Knowles called R Bootcamp. Jared's tutorials are a valuable resource for anyone try to learn to program in R. Below the presentation are links to the handouts and R Code that are used during the HTML5 presentation that is linked below. Enjoy!
Read MoreThis video was created by Dr. Roger Peng, professor at the Johns Hopkins Bloomberg School of Public Health and author at Simply Statistics. Dr. Peng is not affiliated with Stats Make Me Cry in any way and written consent was obtained before this video was posted.
Read MoreSo you've run your general linear model (GLM) or regression and you've discovered that you have interaction effects. Now what? Next, you might want to plot them to explore the nature of the effects and to prepare them for presentation or publication! The following is a tutorial for who to accomplish this task in SPSS. A follow-up tutorial for how to do this in R is forth coming.
Read MoreThis is a fantastic resource created by Dr. William Revelle for running confirmatory factor analysis (CFA) models and structural equation models (SEM) in R using the lavaan package. The tutorial walks through example models, includes example code, discusses multi-group analysis, and even references some advanced functions for producing path diagrams using the psych package in R.
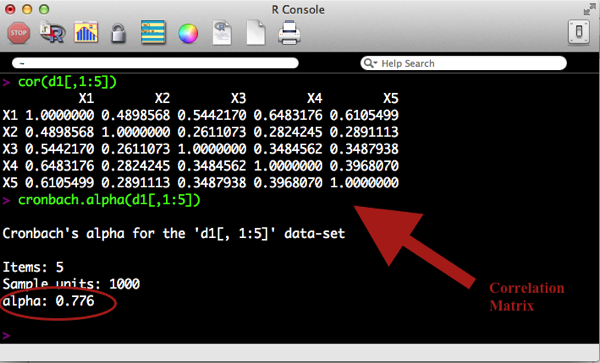
Read MoreInternal consistency refers to the general agreement between multiple items (often likert scale items) that make-up a composite score of a survey measurement of a given construct. This agreement is generally measured by the correlation between items.
For example, a survey measure of depression may include many questions that each measure various aspects of depression, such as:
Read MorePart 3 we used the lm() command to perform least squares regressions. In Part 4 we will look at more advanced aspects of regression models and see what R has to offer. One way of checking for non-linearity in your data is to fit a polynomial model and check whether the polynomial model fits the data better than a linear model. Or you may wish to fit a quadratic or higher model because you have reason to believe that the relationship between the variables is inherently polynomial in nature.
Let’s see how to fit a quadratic model in R...
Read MoreHeteroscedasticity is a hard word to pronounce, but it doesn't need to be a difficult concept to understand. Put simply, heteroscedasticity (also spelled heteroskedasticity) refers to the circumstance in which the variability of a variable is unequal across the range of values of a second variable that predicts it.
A scatterplot of these variables will often create a cone-like shape, as the scatter (or variability) of the dependent variable (DV) widens or narrows as the value of the independent variable (IV) increases. The inverse of heteroscedasticity is homoscedasticity...
Read MoreIn the strictest sense, APA style discourages the use of color in graphics, stipulating that it be used only when it is "absolutely necessary". Consequently, most universities and dissertation committees also discourage (or downright forbid) the use of color graphics in dissertation manuscripts. Personally, i find this irritating, as I think most graphical representations of data can be made more clear with the appropriate use of color. However, I suppose the guideline is meant to provide uniformity and consistency across manuscripts, which is understandable.
Unfortunately, if you use SPSS you've probably already discovered that it produces graphics in color by default. Not to worry, your graphs can be changed easily. Better yet, you can make simple adjustments to your SPSS settings that will force the program to create APA-compliant (i.e. black & white) graphics in all output! Here is how you do it...
Read MoreStructural equation modeling (SEM) is a complex beast, and can be quite intimidating to someone trying to learn the basics. Fortunately, there are some great resources out there for learning! Unfortunately, I think a lot of beginners don't know what those great resources are, or where to find them.
Read MoreIt is quite common in political science for researchers to run statistical models, find that a coefficient for a variable is not statistically significant, and then claim that the variable "has no effect." This is equivalent to proposing a research hypothesis, failing to reject the null, and then claiming that the null hypothesis is true (or discussing results as though the null hypothesis is true). This is a terrible idea. Even if you believe the null, you shouldn't use p > 0.05 as evidence for your claim. In this post, I illustrate why...
Read MoreIn today's blog entry, I will walk through the basics of conducting a repeated-measures MANCOVA in SPSS. I will focus on the most basic steps of conducting this analysis (I will not address some complex side issues, such as assumptions, power…etc). If you find yourself with lingering questions after walking through this blog, feel free to leave questions in the "comments" section, or visit the MANCOVA section of my discussion forum to find answers and/or ask questions of your own. Full disclosure: the example data used is from the SPSS sample/help files, and it can be downloaded below...
Read MoreThis video tutorial demonstrates how to perform some basic manipulations of data in R, including how to: view data, edit data, create subsets of data, remove variables from data, and create new variables in data
Read More
This video tutorial demonstrates how to import data into R that is currently in SPSS format. The video also shows how to do use a few basic commands on datasets, once they are imported into R. The steps in this video apply whether you are using a Mac or a PC/Windows machine.
Read MoreThis video shows how to obtain and install R on the Windows (PC) platform. It also shows a few basic functions in R, such as how to install packages in R and load them for use.
Read MoreThis video shows how to obtain and install R on the Mac OS X platform. It also shows a few basic functions in R, such as how to install packages in R and load them for use. A PC version is here: How to Install R for Windows
Read MoreI have a saying that I like to tell consulting clients, which is easier said than done, but I think are words for doctoral candidates to live by: "The only bad dissertation draft is one that isn't turned-in." The most common factor that unnecessarily slows progress on a dissertation proposal or defense is a propensity to strive for the perfect draft. As a graduate student, we all fantasized of turning-in our first draft and having our advisor, being so amazed at its brilliance, insist that you accept your PhD on the spot...
Read More